SIGNL4 Integration with Prometheus Alertmanager
When critical systems fail, SIGNL4 is the fastest way to alert your staff, engineers, IT admins on call and “in the field”. SIGNL4 provides reliable notifications via mobile app push, text and voice calls with tracking, escalations and duty scheduling.
Prometheus is an open-source monitoring tool that monitors availability and performance. It gives you simple access to relevant data for example using Grafana. SIGNL4 easily enables Prometheus to notify mobile teams in the field or on call in real-time. This speeds up their response significantly and frees resources in the operations.
Pairing Prometheus Alertmanager with SIGNL4 can enhance your daily operations with an extension to your team wherever it is. The integration does not only allow you to know when a critical issue has occurred but also when it was resolved no matter where you are.
The integration of Prometheus and SIGNL4 is done using Alertmanager that is part of Prometheus.
Prerequisites
- A SIGNL4 account (https://www.signl4.com)
- A Prometheus installation (https://prometheus.io)
- An Alertmanager installation (https://prometheus.io/docs/prometheus/latest/configuration/alerting_rules/)
How to Integrate
Alertmanager Webhook
New versions
For Alertmanager v0.32 and later the webhook payload supports parameters.
Alertmanager sends alerts via SIGNL4 using a webhook. The following sample configuration triggers SIGNL4 alerts and automatically closes them when the alert is marked as resolved in Alertmanager.
receivers:
- name: signl4
  webhook_configs:
  - url: https://connect.signl4.com/webhook/{signl4-teamsecret}
    send_resolved: true
    payload:
      Title: '{{ printf "%s - %s" .CommonLabels.alertname (.Status | toUpper) }}'
      Message: '{{ .CommonAnnotations.summary }}'
      Alert: '{{ .CommonLabels.alertname }}'
      Service: '{{ .CommonLabels.service }}'
      Severity: '{{ .CommonLabels.severity }}'
      Status: '{{ .Status }}'
      X-S4-ExternalID: '{{ .CommonLabels.alertname }}-{{ .CommonLabels.job }}'
      X-S4-Status: '{{ if eq .Status "firing" }}new{{ else }}resolved{{ end }}'
      X-S4-SourceSystem: 'Alertmanager'
route:
  group_by:
  - alertname
  - job
  group_interval: 5s
  group_wait: 1s
  receiver: signl4
  repeat_interval: 30s
  routes:
  - match:
      alertname: Watchdog
    receiver: signl4
The important part here is under webhook_configs. You need to replace {signl4-teamsecret} by your SIGNL4 team or integration secret.
The alert format can be adapted to your needs, and you can also add additional parameters as needed. The X-S4- parameters are reserved. More information about the SIGNL4 webhook is available here.
Legacy Version
For versions older than 0.32 you can use the following description.
The integration is done using the standard webhook in Alertmanager. You can find more information here:
https://prometheus.io/docs/alerting/latest/configuration/#webhook_config
A sample configuration in the configuration file might look like this:
receivers:
- name: prometheus-signl4
  webhook_configs:
  - url: https://connect.signl4.com/webhook/
    send_resolved: true
route:
  group_by:
  - job
  group_interval: 5m
  group_wait: 30s
  receiver: prometheus-signl4
  repeat_interval: 10m
  routes:
  - match:
      alertname: Watchdog
    receiver: prometheus-signl4
You need to replace with your SIGNL4 team secret.
Resolved Alerts
This is only required for the legacy approach before Alertmanager v0.32.
In order to close alerts in SIGNL4 when the alerts are closed in Prometheus you can use this SIGNL4 URL.
https://connect.signl4.com/webhook/{teamSecret}?ExtIDParam=groupKey&ExtStatusParam=status&ResolvedStatus=resolved
You can find more information about the resolve feature here:
https://www.signl4.com/blog/update-july-2020-resolve-alerts/
Test It
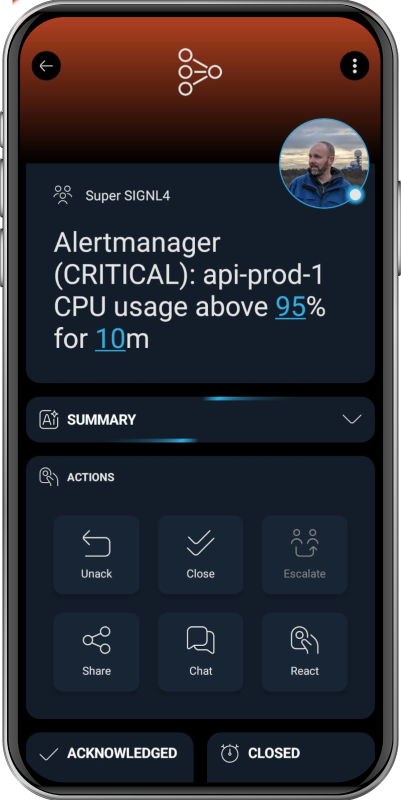
That is it and now you can test the alert. You can for example simulate an alert in Prometheus and you should then receive an alert in your SIGNL4 app.
The alert in SIGNL4 might look like this.